Bicycle sharing systems are becoming increasingly popular in cities, especially the ones with a flat topography. The systems operate by means of stations where users pick up and drop off bicycles as they use them. These stations can be manual or automatic.
In manual stations, a person is responsible for lending and receiving the bicycles to each user. In contrast, in the automatic stations, there are a limited number of anchor points from which the bikes can be loaned and to which you have to hook the bike that you want to return. If users wish to return their bikes and do not have empty anchor points, they will have to move to another station or wait for another user to release the anchor point.
One of the main challenges of these bicycle-sharing systems is the lack of predictability of usage to keep the constant availability of bicycles and anchor points. In other words, the system has to keep bikes available by the time the user approaches the station to pick up a bicycle and, on the other hand, have anchor points available when the user wants to drop it off.
It can be considered to a certain extent that the flow of passengers is usually from the same origin to the same destination. For example, in the mornings, university students often travel from subway stations to make the last mile to their institutions by bike.
Create a model that indicates the optimal movement of bicycles to be made between stations and at what times or frequencies - load balancing system.
GOAL 11: Sustainable Cities and Communities
The following datasets were provided to the participants:
Several teams noticed errors in the provided dataset, such as duplicate entries, missing values, drop-off times before the pick-up times, and loan durations that were too long (e.g., more than one year).
One team used weather data as a possible correlating factor with bike usage, and another gathered data of bank holidays in Colombia to analyze its impact on the number of bike loans. There was also a team using a combination of both.
All teams focused extensively on exploratory data analysis to understand the mobility patterns of the bike-sharing system. The first steps in that exploration were spent cleaning data after teams realized that the dataset had some inherent errors - one team did a particularly thorough data cleaning process. This same team then focused on the bike station that had the most observations (pick-ups and drop-offs) and analyzed it even further. They looked at the correlation between weather and the difference between loans and drop-offs, and after that, they performed autocorrelation on an hourly and daily level. Regarding modeling, they firstly focused on predicting the difference between pick-ups and drop-offs for that specific station, using a Random Forest Regressor on a particular period - obtained results were an R2-score of 0.47. They then extended this model to a group of bike stations, namely the top 15 bike stations, for which the R2-score ranged from 0.00 to 0.86.
Another team focused on characterizing stations according to their different usage patterns and found three different types: stations that receive more than they lend, stations that lend more than they receive, and stations that receive and lend in the same proportion. For that, they mainly resorted to data visualization. This team used a CNN to predict the maximum balance between pick-ups and drop-offs for each station on each day and obtained a Root MSE of 9.34. They then used the predictions of this model to build a graph that performs load balancing between nodes. This graph was built using heuristics, considering, among other factors, the distance between stations.
After EDA, one team approached the problem as a forecasting task - for the bike demand prediction - followed by spatial data analytics - for exploring route options between bike stations - and lastly, an optimization step - for defining how many bikes should be transported. Due to a lack of time, this team only produced a model for the forecasting task. The team used a Gradient Boosting algorithm for a forecast of one day and two days in advance, with a Root MSE of 17.2 and 18.6, respectively.
Several teams noted the fact that the median duration of a bike loan is 14 minutes.
After an extensive exploration step, one team found several insights regarding the historical usage of the bike-sharing system.
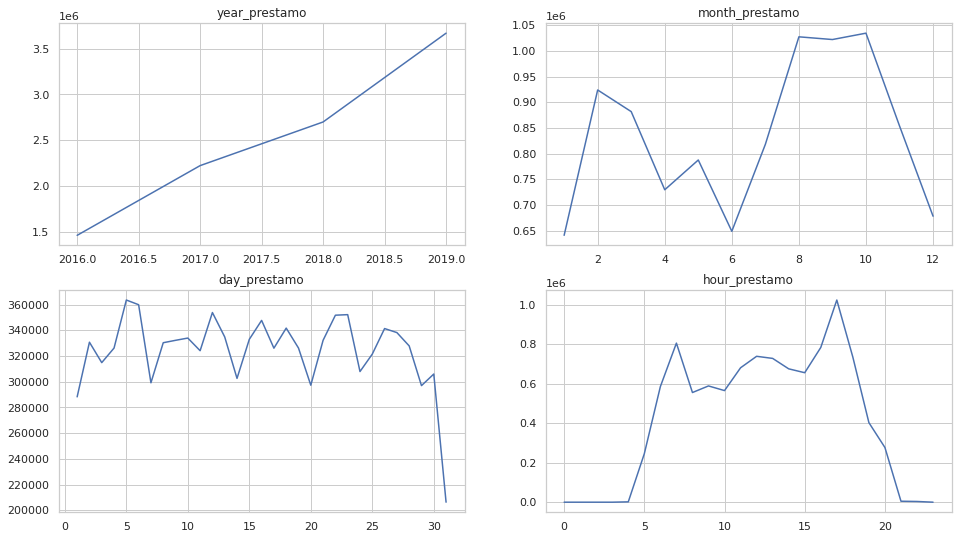
The graphs represent historical usage of the bike-sharing system, comparing the number of loans (y-axis) with different time scales (x-axis) - top left: number of loans throughout the years; top right: average number of loans per month of the year; bottom left: average number of loans per day of the month; bottom right: average number of loans per hour of the day.
We can see that, over the years, there has been a constant increase in the use of shared bicycles, which proves that more and more people are using them.
Regarding monthly usage, August, September, and October are the months with more usage, while January, June, and December are the ones with the least. This could mostly be due to weather conditions and the number of tourists.
Over a single month, the number of loans per day remains quite similar, with minor fluctuations.
Throughout the day, two peaks stand out, coinciding with the rush hours (one in the early morning and the other in the late afternoon). There is also a peak at lunchtime. These three-day moments are the busiest because they include commuting home-work, work-home, and even traveling to lunch. It is also possible to identify approximately the opening and closing times of the stations - 4 am and 10 pm, respectively.
This same team also focused on characterizing stations according to their different patterns of usage and found three different types: stations that receive more bikes than they give, stations that give more than they receive, and stations that receive and give in the same proportion. They found that different types of stations also have very different types of user behavior. For example, one station had a usage trend that has been consistently rising throughout the years. In contrast, another had a trend that had virtually stayed the same throughout the years, and that had a big drop in the month of December.
Another team, whose technical approach focused on the bike stations with the highest amount of loans, noticed that the top 15 bike stations account for 45% of the bike demand of the whole system.
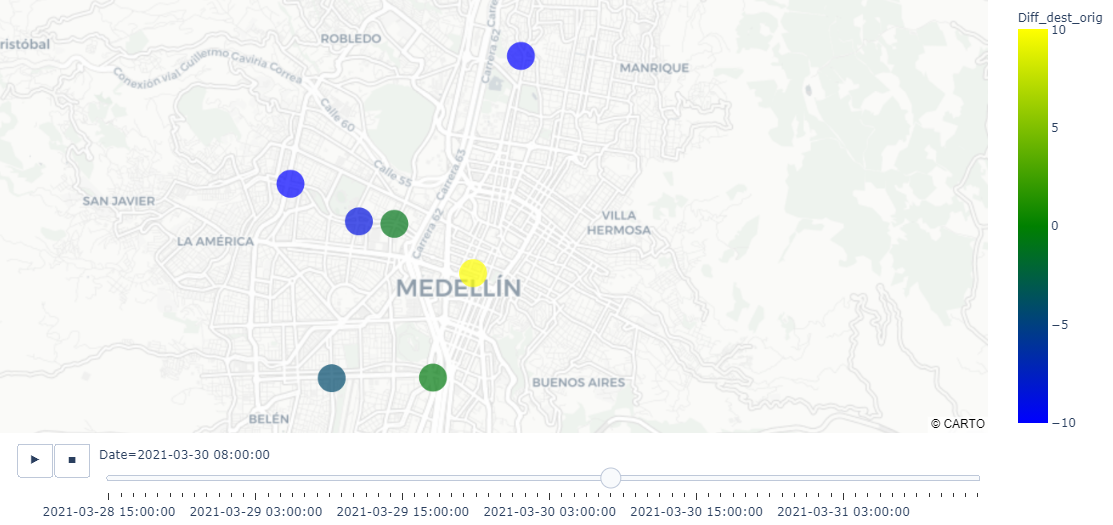
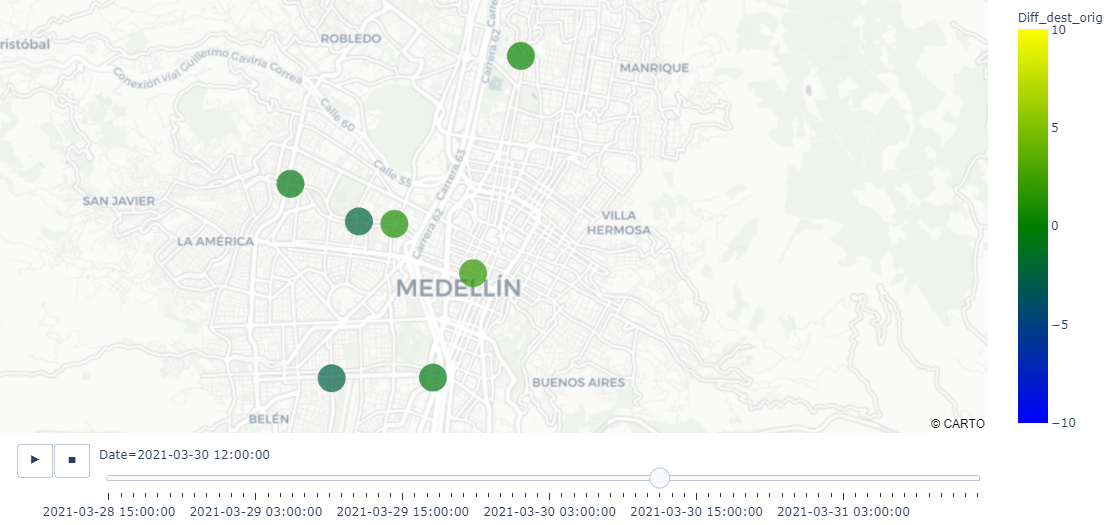
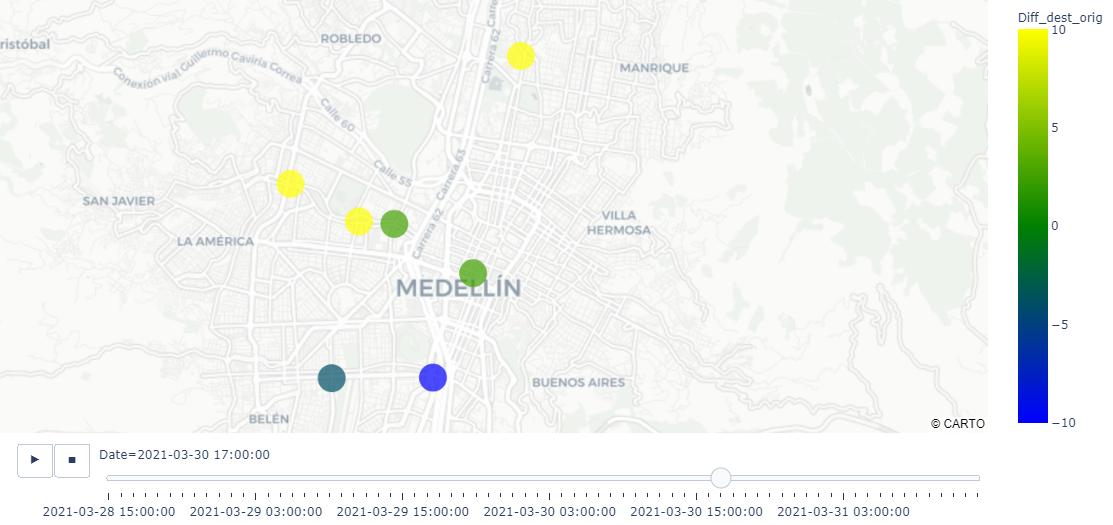
One team proposed a product solution based on their technical developments. They suggested a Bike Balancing Map that used a color-code system to represent stations that were balanced, stations that should receive bikes, and stations that should give away bikes. They tested this solution on six bike stations and showed how depending on the time of day, certain stations should receive bicycles (blue) from other stations (yellow) and that some stations are balanced (green).