
According to the 2017 UN’s Global Mobility Report, “road transport claims the bulk of transport-related fatalities worldwide: It accounts for 97 percent of the deaths and 93 percent of the costs. On roads, the fatality risk for motorcyclists is 20 times higher than for car occupants, followed by cycling and walking, with seven to nine times higher risk than car travel, respectively. Bus occupants are ten times safer than car occupants. Rail and air are the safest transport modes.”
So, decision agents must know where to “improve the safety of mobility across all modes of transport by avoiding fatalities, injuries, and crashes from transport mishaps”. That is why creating a model that identifies areas or roads with more considerable risks will help determine where to invest in road safety and which actions are needed.
The goal is not to predict accidents. Instead, it is to identify hazardous roads, so that decision agents take measures on where they need to act in their cities to improve road safety.
Identify which areas of Lisbon, Porto, or both are riskier by creating an intensity model that considers traffic intensity data, characteristics of road segments, and their speed profile. This model should identify the most conflictive areas or roads.
GOAL 11: Sustainable Cities and Communities
The following datasets were provided to the participants:
Most teams found that the data provided was already enough to provide a model for identifying hazardous segments in a city. As external data, one team used OpenStreetMaps to extract amenities and other characteristics found in the road segments, such as police stations, traffic lights, and pedestrian crossings, assuming that there could be specific cues that might impact driver behavior. Another team used roundabout presence, rainfall, and geographical data of the parish with its population.
As a criticism of the data provided, it was noted that ground truth would be great to ensure that the model could be validated. For instance, a dataset of car crashes for the same period as the dataset would have been important. Other interesting data points would be the state of the road and road construction. Some teams also mentioned that provided the data was more granular (e.g., daily basis), it would have been possible to use weather data to enrich the model.
Since no labels were given for what is considered a “hazardous segment”, each team used their own assumptions and techniques to classify the road segments. Two teams used the K-Means clustering algorithm to either separate road segments as non-hazardous and hazardous (2 clusters) or give different levels of hazardousness (5 clusters).
As speed limits and speed statistics were included, one team used classification (Logistic Regression and Gradient Boosting classification) to predict if a road segment is likely to have overspeeding and regression techniques (Linear Regression and Gradient Boosting regression) to predict the difference between the average speed and the maximum speed.
By using data regarding speed limits and the average traveling speed on the road, it was shown by several teams that it is possible to create models which can later be used by policymakers, government officials, and law enforcement to identify which are the most crucial roads for monitoring and intervention. Combining this data with the number of accidents can increase the model's usefulness.
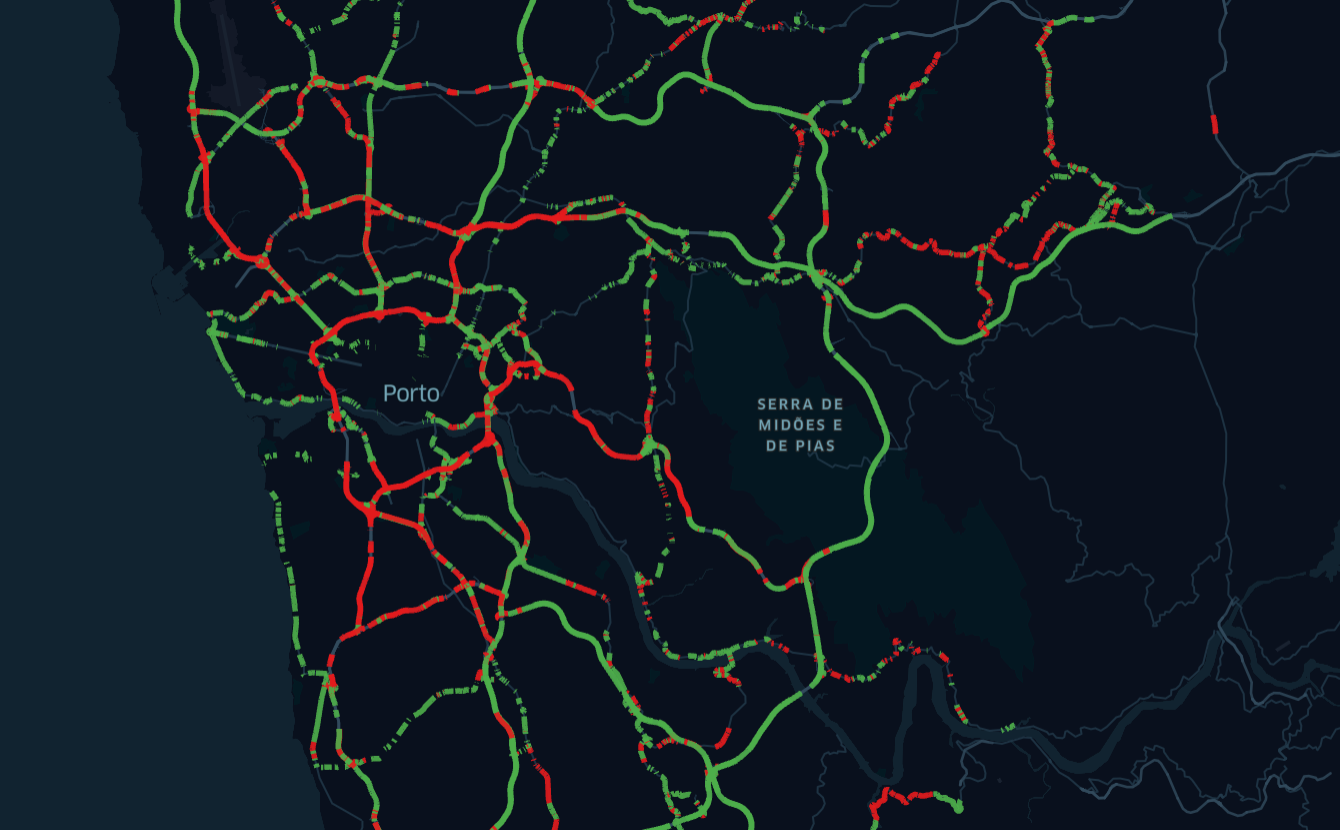
The type of tools that is possible to produce is exemplified in Figure 1, where a map clearly shows which road segments tend to be more hazardous due to an increase in average speed.
One team went a step further and predicted the likelihood of infraction and how much the speed, on average, deviates from the maximum speed. Their model considered the presence of traffic lights, pedestrian crossings, and others. Unfortunately, there was no analysis of each effect of the prediction, but that could be performed in the future.

